Bots That Watch the Data Find More Than Dashboards Do
I have written about how I manage a team of AI agents, how I run a mostly automated dev organisation and what three years of GitHub data show about that change. This post is about the same idea applied to data: a bot that watches the data finds more than a dashboard, because it looks every day at the things nobody has time to look at. And once a finding comes with a note and a proposed action, a large part of the follow-up can be automated, with a human yes where it matters.
The charts below are an illustrative model, not measured data. They show the shape of the change under stated assumptions, not a result from a specific team.
TL;DR: key takeaways
- Dashboards wait. They only produce a finding when someone opens them, looks at the right chart and notices something. Most data is not looked at in a given week.
- Bots ask. A bot runs the same questions on a schedule, compares the answers with what is normal and writes a short note when something moved.
- The way of working is question → finding → action. Each step is written down: the question, the evidence, and the proposed action with an owner.
- In the illustrative model, a team that adds a watching bot goes from about 3 findings a week to about 13, and from about 1 action a week to about 8, of which roughly 59% run automatically, 27% run after a human yes and 14% stay manual.
- Guardrails decide what is automatic. Reading, alerting and flagging can run on their own. Anything that changes shared material or goes out in someone’s name waits for approval.
- Two anonymised examples: a large sports dataset in a side project, and the data platform of a global industrial group in my day job.
Why dashboards miss things nobody looks at
A dashboard is a good answer to a question someone already has. It is a poor way to discover questions nobody has asked yet. In practice:
- Attention is the bottleneck. A monthly review covers the top charts. The long tail of markets, products, sources and edge cases is rarely opened.
- Slow drift is invisible. A metric that moves a little every week never looks alarming on any single day.
- Broken data looks like quiet data. A source that stopped updating often shows up as a flat line, not as an error.
- Nobody owns the gaps. Data quality problems sit between teams, so everyone assumes someone else has seen them.
None of this is a dashboard problem as such. It is a looking problem. A bot does not get bored, does not skip the long tail and does the same check on the 300th table as on the first.
The way of working: question → finding → action
- Questions, written down. A short list of questions per dataset: what should be true every day, what is normal, and what would be worth knowing. Each question is a query that can run on a schedule.
- Scheduled runs. The bot runs the questions daily or weekly and stores the answers, so “normal” is measured, not guessed.
- Anomaly detection. It compares each answer with its own history and flags what moved outside the expected range, what disappeared and what appeared.
- A note per finding. For each real change the bot writes a short note: what changed, the evidence and the query behind it, how sure it is, and a proposed action with an owner.
- Actions, with a gate. Low-risk actions run automatically. Anything else becomes a proposal that waits for a human yes, the same way merging and publishing do in my agent setup.
The note is the step that matters most. A raw alert is easy to ignore. A note that says what changed, why it probably matters and what to do next is something a person can approve in ten seconds.
Chart A: findings per week
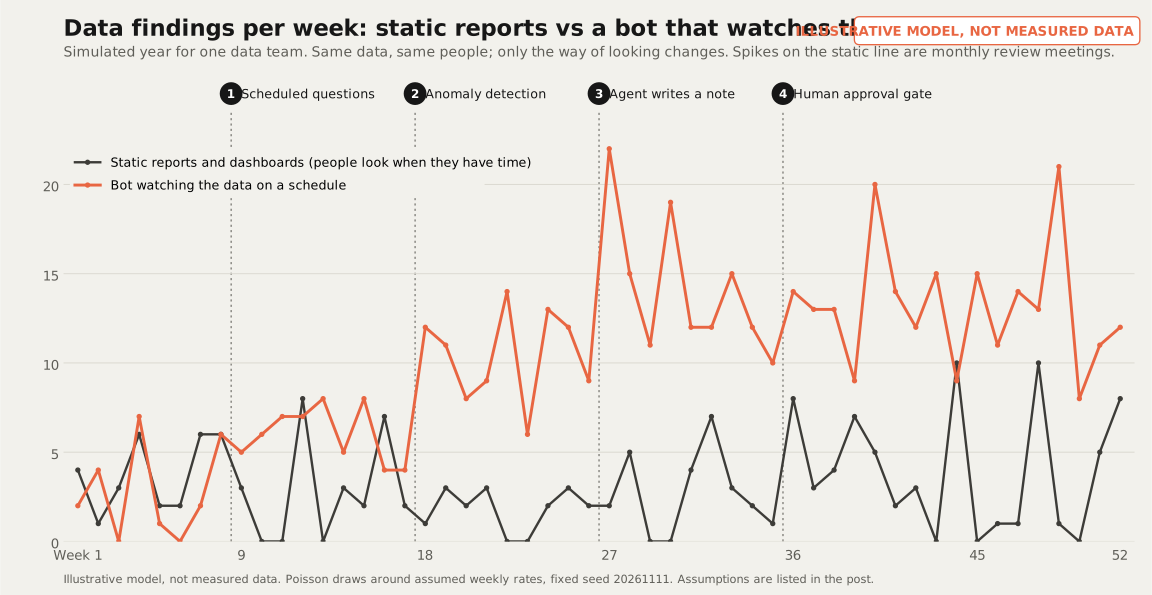
Both lines describe the same data and the same people. Only the way of looking changes. The four milestones are the steps in the way of working above: scheduled questions, anomaly detection, an agent that writes a note, and a human approval gate.
Chart B: what happens to the findings
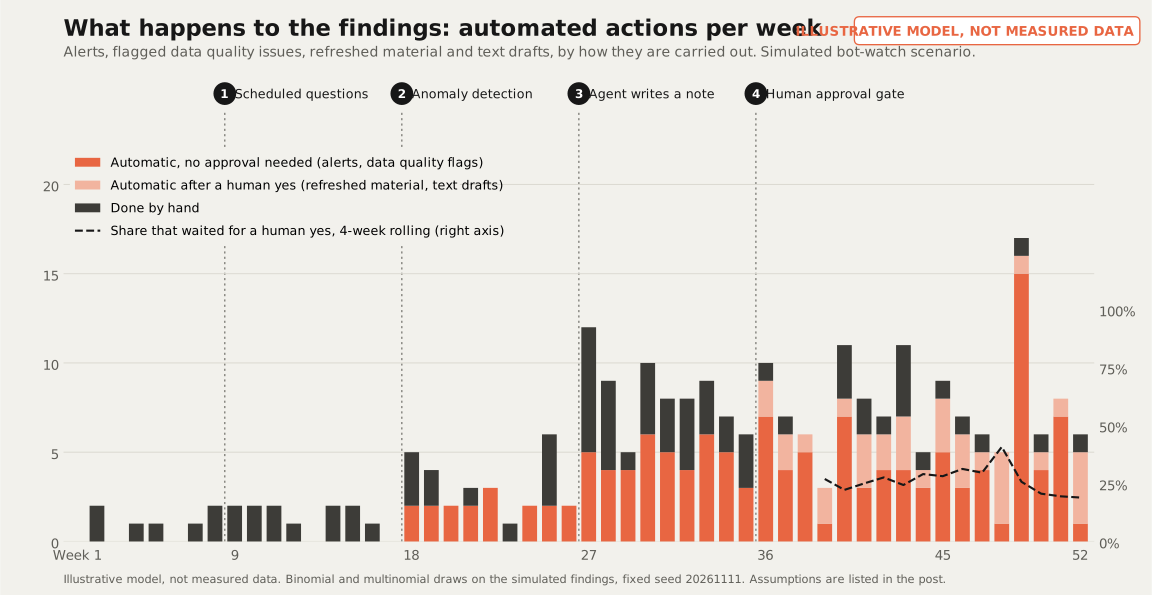
The actions are of four kinds: alerts to the owner of a metric, flagged data quality issues, refreshed material such as an updated table or report section, and text drafts such as a summary for a meeting. In the model, alerts and flags run without approval. Refreshed material and drafts run only after a human yes. A share of actions always stays with a person, because some findings need judgement no matter how good the note is.
The assumptions behind the model
The model is a simulation of one data team over 52 weeks, with Poisson and binomial draws around the rates below and a fixed random seed (20261111), so it produces the same charts every time.
| Assumption | Value in the model |
|---|---|
| Findings from static reports and dashboards | 2 a week, plus 4 extra in a monthly review week |
| Findings with the bot, before week 9 | Same as static |
| After scheduled questions (week 9) | 6 a week |
| After anomaly detection (week 18) | 12 a week |
| After the agent writes notes (week 27) and the approval gate (week 36) | 14 a week |
| Share of findings that lead to an action | 30% without a note, 60% with a note |
| Mix of actions | 40% alerts, 25% data quality flags, 20% refreshed material, 15% text drafts |
| Needs a human yes | Refreshed material and text drafts; alerts and flags do not |
| Always handled by a person | 15% of actions |
| Automation before anomaly detection | None; all actions are manual |
With those assumptions, weeks 36 to 52 average about 13 findings a week for the bot scenario against about 4 for static reports in the same weeks, and about 8 actions a week, of which 59% are automatic, 27% are automatic after approval and 14% are manual. Change the assumptions and the numbers change. The direction is the point, not the exact values.
Example 1: a large sports dataset
In a side project I work with a large sports dataset: matches, players and events over many seasons. Nobody can look at all of it, and nobody does. The questions a bot can ask every day are simple:
- Did every match that was played get its events, and do the totals add up?
- Are there players or teams whose numbers moved far outside their own normal range?
- Did a source stop updating, or start returning duplicates?
- Is there a pattern worth writing up, for example a metric that has changed direction over several weeks?
The typical findings in a dataset like this are boring and valuable: a missing match report, a duplicated record, a source that changed its format. A few are interesting enough to become a draft text for me to review. The bot does the looking; I decide what is worth saying.
Example 2: a global industrial group with many data sources
In my day job at a global industrial group I built and run a governed lakehouse that brings together data from more than 20 source systems: ERP, CRM, service management and web analytics, among others, in around 100 production jobs and more than 600 tables. On top of that sit dashboards across 14 European markets, data agents and integrations that surface insights proactively.
The most important change there was not technical. We shifted the analytics approach from advanced dashboards to alerting with drill down: instead of asking people to find the problem in a dashboard, the platform tells the right person that something changed and links straight to the detail. Governance was a design input from the start, with lineage, access control and daily quality checks, so that a finding can be trusted and traced back to its source.
With that many sources, the long tail is enormous. Daily quality checks and scheduled questions are built to catch the kind of thing a monthly review would not, for example a source that quietly stops loading, a field whose meaning changes upstream or a market whose numbers drift. That is exactly the gap a watching bot fills.
Guardrails and approvals
Automating the follow-up is only safe with clear rules. The ones I use:
- Read-only by default. The bot reads data and writes notes. It does not change source data or reports on its own.
- Automatic only when cheap to undo. Alerts to the owner and data quality flags can run without approval. They inform; they do not change anything.
- A human yes for anything shared. Refreshed material that others act on, text drafts and anything sent in someone’s name wait for explicit approval. One yes covers one action.
- Evidence with every finding. Each note includes the query and the numbers behind it, so the approver can check it in seconds.
- An owner per question. Every scheduled question has a named owner, and findings go to that person, not to a shared channel nobody reads.
- Silence when nothing changed. A bot that reports “all fine” every day trains people to ignore it.
These are the same rules I described for agents in general, applied to data.
Where to start
- Pick one dataset that matters and that nobody looks at often enough.
- Write down five questions that should have a stable answer every day.
- Run them on a schedule and store the answers, so you have a baseline.
- Flag what moves outside the baseline, and send it to a named owner with the evidence.
- Only then add notes, proposed actions and an approval gate.
Dashboards are still where you go to understand a finding. A bot that watches the data is how you find out where to go.