Three Years of My GitHub Activity, Before and After AI Agents
Since early 2026 I have done most of my building together with AI agents, and I have written about how I manage that team of agents. This post is the numbers behind it. I pulled three years of data from the private side projects on my personal GitHub account and charted it month by month, with the moments that changed how I work marked on the chart.
My short answer: in my private side projects, commits per month went up 851% after I started using AI agents every day, but commits without any AI trailer, the part closest to my own effort, went up 210%. That 210% is the fairest number, and none of these is a clean measure of productivity.
TL;DR: key takeaways
- The data. My private side projects: every commit on the default branch of the repositories my personal GitHub account owns, public and private, plus pull requests, new repositories and my GitHub contribution calendar, from November 2023 to 11 November 2026. 3,256 commits and 844 pull requests in total.
- Before. In the 12 months before daily AI use (February 2025 to January 2026): 27 contributions and 32 commits a month, work in about 3 repositories a month, and practically no pull requests.
- After. In February to October 2026: 296 contributions (+995%) and 305 commits (+851%) a month, about 24 active repositories (+607%) a month, and merged pull requests from about zero to 57 a month.
- Who wrote it. Of the commits since February 2026, 33% are mine without an AI trailer, 42% are co-authored by an AI assistant, 21% are written by an agent and 5% come from bot and project identities, such as dependency updates and commits pushed through the GitHub API.
- The honest part. Commits without an AI trailer rose 210% (32 to 99 a month), not 851%. That is the fairest number to quote, and it is still activity, not productivity. Agents commit in smaller steps, and some of the growth is moving existing projects into GitHub.
The chart
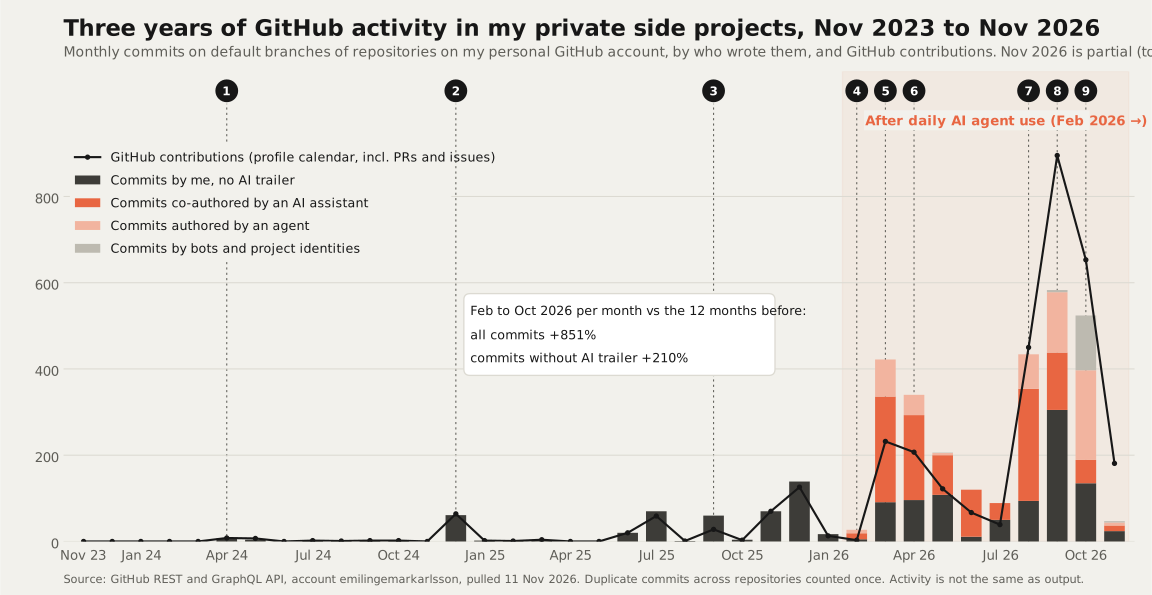
The bars are commits per month, split by who wrote them. The black line is the contribution count from my GitHub profile calendar, which also counts pull requests and issues. The shaded area is the period after I started using AI agents every day, and the box shows the change in commits per month against the 12 months before.
The milestones on the chart
Every milestone comes from the data itself: a commit, a pull request or a repository creation date.
- April 2024: this site gets a repository. The first commits are manual uploads of the site, version by version.
- December 2024: a rebuild by hand. 61 commits in one month on this site: navigation, layout, theme toggle and tracking, all written by me.
- 22 September 2025: the first AI-written pull request. A coding agent in my editor opened a pull request on this site that fixed a freezing mobile menu. It was a one-off for a long time.
- February 2026: daily AI use starts. The first commit co-authored by a coding assistant lands on 3 February, in a data platform side project, and on 23 February an autonomous SEO agent starts committing articles to this site.
- March 2026: the first big step. The first commit co-authored by a second AI model arrives on 20 March. The month ends with 422 commits across 17 repositories, more than the whole previous year.
- 13 April 2026: eleven repositories in one day. I moved existing projects into GitHub. That is housekeeping, not output, and it is one reason the repository count grows.
- 24 August 2026: cloud coding agents start opening pull requests. The first was on this site and added error monitoring. Merged pull requests went from 2 in July to 101 in August, because the way of working changed from committing directly to reviewing pull requests.
- 2 September 2026: the issue-to-pull-request loop. A coding agent picked up a GitHub issue on its own and opened a pull request, which I reviewed and merged. September became the busiest month: 895 contributions and 216 pull requests from agent branches.
- October 2026: agents write more commits than I do. 208 commits written by agents against 135 under my own name, plus 127 commits under project identities, mostly pushed through the GitHub API by my own agents.
Before and after, in numbers
| Per month | Before (Feb 2025 to Jan 2026) | After (Feb to Oct 2026) | Change |
|---|---|---|---|
| GitHub contributions (profile calendar) | 27.1 | 296.4 | +995% |
| Commits, all authors | 32.1 | 305.0 | +851% |
| Commits under my name without an AI trailer | 32.1 | 99.4 | +210% |
| Repositories with at least one commit | 3.3 | 23.6 | +607% |
| Merged pull requests | 0.1 (1 in 12 months) | 56.6 | from about 0 to 57 |
The percentages compare monthly averages: the 12 months before against the nine full months after. November 2026 is left out because it is not over. I give no percentage for pull requests, because a base of one merged pull request in a year makes any percentage meaningless.
I use the 12 months before February 2026 as the baseline rather than the full period since November 2023, because the first five months of the period have no activity at all in this account. Comparing against the full 27 months would make the change look even larger, which would not be fair.
Why activity is not productivity
I want to be clear about what this data does and does not show.
- Agents commit differently. A coding agent makes a commit per small step and a pull request per task. I used to make one large commit at the end of an evening. The same amount of work produces many more events.
- Agents fix their own mistakes. Some of the commits are corrections of what an agent did a few commits earlier. That is activity, and some of it is waste.
- The workflow changed. Before August 2026 I mostly committed straight to the main branch. Now almost everything goes through a pull request that I review. Pull request counts jumped because of the process, not only because of more work.
- My share is overstated. Commits count as mine when they have no AI trailer, but not every tool leaves one, and some assistant work is committed under my name.
- Some of it is bots. Dependency updates and commits pushed under a project identity show up as commits too. I have separated what I could, but the line between my agents and my bots is not always visible in the metadata.
- Moving projects in is not building them. Projects that already existed elsewhere show up as new repositories in 2026.
- The chart only sees this account. Work in employer or client systems is not in it, which is most of my working hours.
So what can I say? The way I build changed visibly in February 2026, and again in August and September when agents started to open pull requests from issues. In the same period I have shipped more side projects, posts and internal tools than in the years before, and the part of the activity closest to my own effort rose 210%. I would put my real productivity gain somewhere between that +210% and the +851% headline, and I would not trust anyone who claims a precise number from commit data, including me.
How I pulled the data
- Commits. The GitHub REST API, every repository my personal account owns, default branch only, from 1 November 2023. Commits that appear in several repositories are counted once, and commits from upstream template authors are excluded.
- Who wrote a commit. Agent identities as authors count as agent commits. A Co-authored-by trailer from an AI tool counts as AI co-authored. Dependency bots and project identities that push through the GitHub API are a separate group.
- Pull requests and repositories. The REST API, all states, by creation and merge date.
- Contributions. The contribution calendar from the GitHub GraphQL API, the same numbers as on a GitHub profile.
If you want to do the same for your own account, the GitHub CLI is enough: list your repositories, page through the commits and pull requests of each, and group by month. The interesting part is not the totals but the split by who wrote what.
What I would measure instead
If I wanted to prove a productivity gain, I would measure outcomes, not events:
- features, posts and tools that actually went live, per month
- issues closed that someone asked for
- time from idea to production
- how much rework follows a merge
That is a harder dataset to build. Activity data is still useful for one thing: it shows exactly when a way of working changed. On this chart, that is impossible to miss.