historical
From SLA Reporting to Proactive IT Operations
Context
In 2018, I worked with IT operations data that was primarily used for retrospective SLA reporting. I wanted to make the same ServiceNow history useful for improvement work: finding recurring incidents, shifts in resolution time, and areas where teams could intervene earlier.
My Contribution
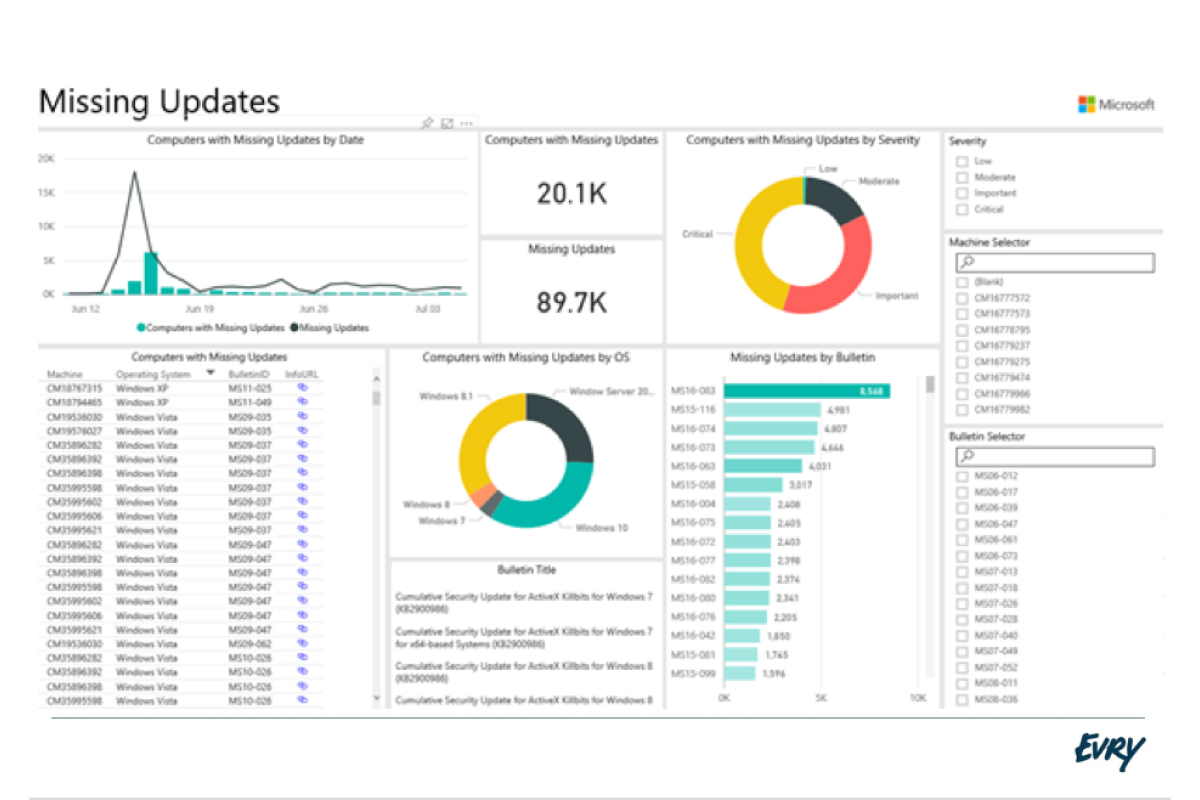
I shaped the analytical approach, prepared SQL-based datasets, and built the Power BI dashboard shown above. The work connected incident history, service levels, and operational patterns in one interface for managers and delivery teams.
Scope
- Data Collection and Analysis:
- Gather relevant data from various sources, including incident logs, performance metrics, and historical records.
- Analyze this data to identify patterns, trends, and anomalies related to SLAs, service quality, and operational efficiency.
- Trend Identification:
- Focus on key performance indicators (KPIs) such as response time, resolution time, and uptime.
- Proactive Suggestions:
- Generate proactive recommendations based on identified trends.
- For example, if a recurring issue is detected during specific hours, suggest adjustments to resource allocation or preventive maintenance during those times.
- Dashboard and Reporting:
- Create an interactive dashboard that visualizes SLA performance, trends, and improvement opportunities.
- Provide real-time insights to stakeholders, including IT managers, support teams, and decision-makers.
- Operational Review:
- Share evidence and improvement hypotheses with the people responsible for service delivery.
- Continuous Improvement:
- Implement a feedback loop to monitor the impact of suggested improvements.
Technology Stack
- BI Tool: Power BI
- Database: SQL
- ITSM Tool: ServiceNow
Outcome
The result was a move from a static SLA view toward an exploratory operations dashboard. It made recurring patterns and improvement opportunities easier to discuss with the responsible teams. I do not have verified long-term impact figures for this historical project, so I present the delivered analytical capability rather than claiming savings or incident reductions.
When: 2018
Want to compare notes?
I am always interested in thoughtful conversations about the decisions, trade-offs, and systems behind this work.
Get in touch